
Access to real-time data on competitors’ digital advertising strategies.
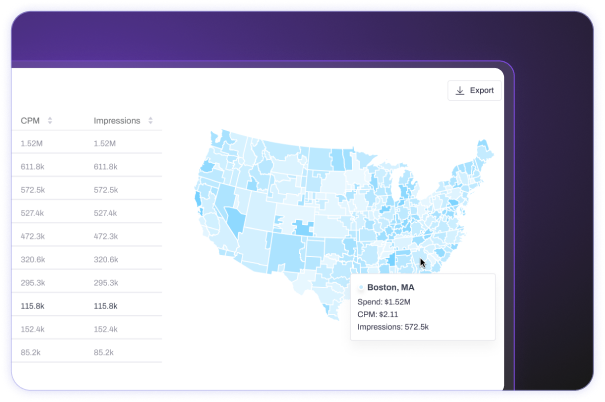
Monitor ads across multiple regions and platforms.
Compare clients’ performance with competitors to spot opportunities.

Identify gaps in ad placement and optimize clients’ campaigns accordingly.

Measure clients’ share of voice in comparison to competitors.
Create tailored, in-depth reports for each client’s unique needs, with the option to white-label reports as part of the agency’s own service offering.

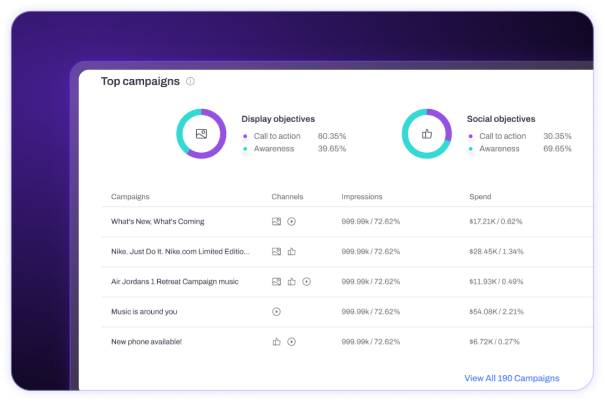
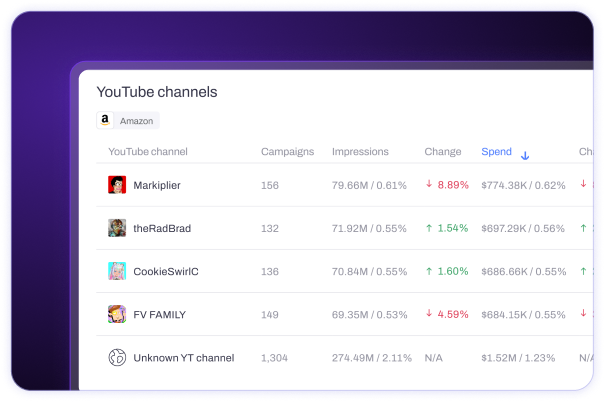
Analyze competitor creatives, audience targeting, and ad metrics to help agencies refine client strategies and reach their target audience.

Monitor global ads across display, video, social, and mobile channels for full visibility into competitors’ strategies.
Compare your clients’ ad performance against the industry benchmark to uncover growth opportunities and optimize campaign strategies.
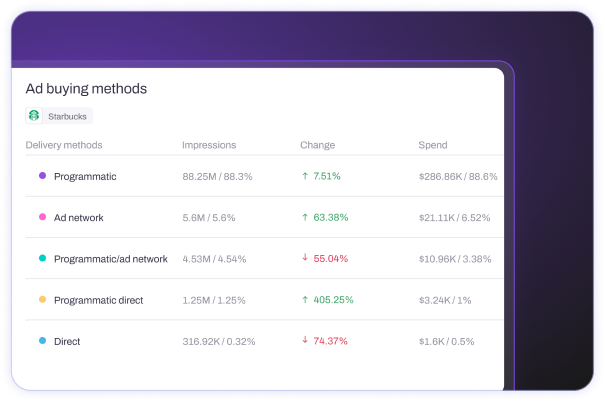
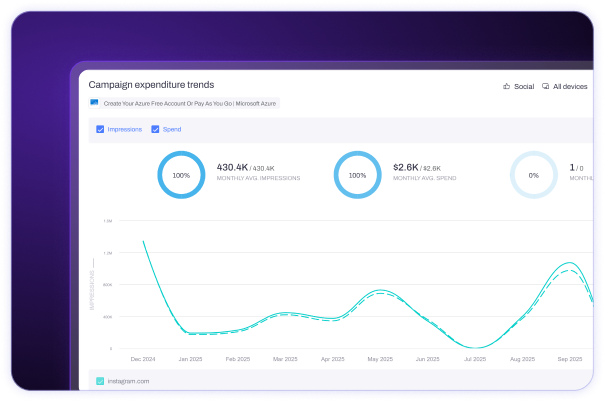
Analyze your clients’ ad spend compared to competitors and the industry benchmark to optimize budgets and maximize ROI.
Benchmark your performance within specific categories by creating tailored reports. Discover insights, metrics, and data to align with your unique KPIs and showcase competitive standing.
Deliver comprehensive, category reports with detailed competitive insights and ad performance metrics to enhance client strategies.
Refine your ad campaigns with data-driven insights. Identify what works, adjust tactics, and maximize your clients’ ad performance.
Gain a competitive edge with in-depth insights into competitor ad strategies. Uncover trends, evaluate creatives, and use benchmarking data to enhance your market position.


It’s comparing your advertising spend, impressions, formats and results against industry or competitor averages to see where you over- or under-perform.
Benchmarks reveal hidden inefficiencies, highlight strengths and give context for targets you can’t get from last year’s figures alone.
Update as frequently as the data changes – daily for live dashboards, at least quarterly for strategic reviews – to keep insights relevant.
Display, social, video and mobile ads are usually tracked for impressions, spend, CPM, CPC and CTR.
Match on industry, region, company size and budget tier to ensure fair “like-for-like” comparisons.
Sample bias, low-traffic sites and seasonal spikes can all skew averages; flag these before drawing conclusions.
Internal, competitive, functional and generic benchmarking are the four standard approaches.
Use an industry report or calculator: divide total spend by impressions (for CPM) or clicks (for CPC) and compare to published sector medians.
Holidays and other peaks raise demand and costs, so compare like periods (e.g., Q4 vs Q4) to avoid false alarms.
