Whether you’re a premium news site, entertainment outlet, or niche digital media brand, AdClarity helps you:
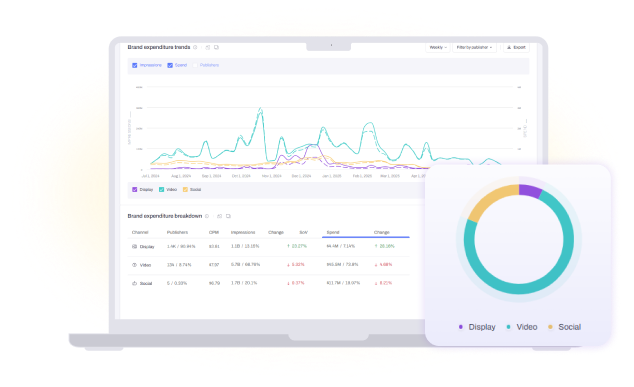
Understand who's spending - where, how much, and on what.
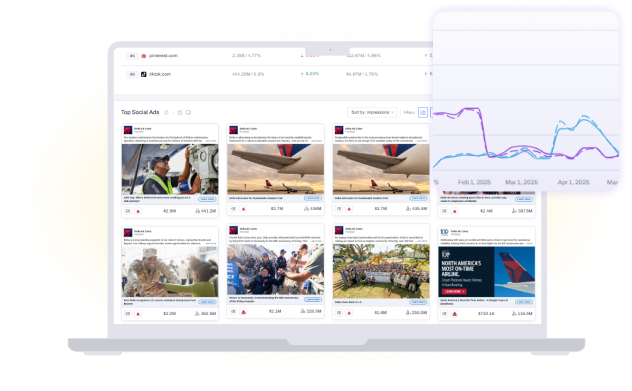
See which brands and agencies are active on your competitors' sites, what creatives they're running, and where the ad dollars are really going.
Use this to build better pitches, upsell smarter, and protect your market share.
Stop relying on guesswork or outdated reports.
With AdClarity, you can:

From display and native to video and programmatic – AdClarity tracks it all.
All in one easy-to-use platform, updated daily.

Header bidding. Programmatic direct. Open exchanges.
We make the ecosystem easier to navigate, giving you visibility into who’s buying, how they’re buying, and what they’re paying.
As cookies crumble, context becomes king.
AdClarity helps you understand advertiser intent and creative strategies – without relying on third-party cookies – so you can adapt your sales strategy with confidence.

Show strategy alignment with market trends. Defend spend. Secure growth budgets.

Uncover underperforming channels and outperform competitors with data-backed shifts.

Build smarter, market-aligned media strategies and report impact with clarity.


Systematically tracking which brands, creatives and budgets appear on comparable sites so you can pitch new advertisers, set floor prices and optimise inventory value with data, not guesswork.
It shows which sectors are active, what formats they buy and at what price, helping you approach the right prospects and justify rates with market evidence.
Most feeds process log files or ad-tag crawls hourly and refresh dashboards daily; check live data during major campaigns and review weekly for sales planning.
Prioritise advertiser count, impressions, spend, CPM, share-of-voice, frequency, creative size and landing-page category to gauge demand and pricing power.
Compare against properties with similar content focus, audience size, geography and ad load; excluding very large or niche sites keeps benchmarks realistic and actionable.
Direct-sold deals without tags, walled-garden inventory and rapid creative rotation may be under-tracked; treat figures as directional and confirm with your own ad-server logs.
Q4 holidays, sports events and product launches boost demand and CPMs; compare year-on-year for identical periods or adjust with seasonal indices before judging performance.
Common uses include prospecting new advertisers, tracking share-of-wallet shifts, spotting under-monetised pages and testing the impact of new formats on yield.
