Digital Games is a large advertising category, but the competitive set inside it is anything but uniform. A storefront, a mobile rewards platform, a tactical shooter, and a farming simulation may all appear in the same broad market view, even though they compete for different audiences and budgets.
AdClarity’s media-mix view captured $326.3M in estimated US Digital Games spend across all covered channels during H1 2026. The category report also identified 847 advertisers, 8.7K campaigns, and 143.5K creatives. AdClarity Topics adds the missing product layer through Topics, Sub-Topics, and Tags.
Social Dominated the Media Mix
Social media advertising generated $232.1M, or a staggering 71.1% of channel-level spend. Video followed at $65.2M and 20.0%, while CTV contributed $16.2M, Display $11.2M, Linear TV $1.5M, and the recently launched ChatGPT Ads about $90K.
The split shows a market built for both scale and impact. Social advertising delivered the largest volume, while Video and CTV gave game marketers more room for trailers, gameplay, and launch storytelling. CTV represented only 5.0% of spend, but its $26.88 CPM was far above Social’s $6.97, reflecting the higher cost of premium television exposure.

Spend Rebounded at the End of H1
The market did not move in a straight line. Spend reached $61.8M in January, declined to $49.8M in February, returned to $61M in March, and then softened through April and May. June recovered to $61.3M, nearly matching the January high.
That pattern matters for planning. A six-month total can hide the timing of competitive pressure. Looking at spend by month, channel, Topic, and title makes it easier to distinguish sustained investment from short campaign bursts. These historical patterns can inform which channels, genres, and campaign windows teams evaluate when setting 2027 budgets.

Shooter and Simulation Led the Genre Mix
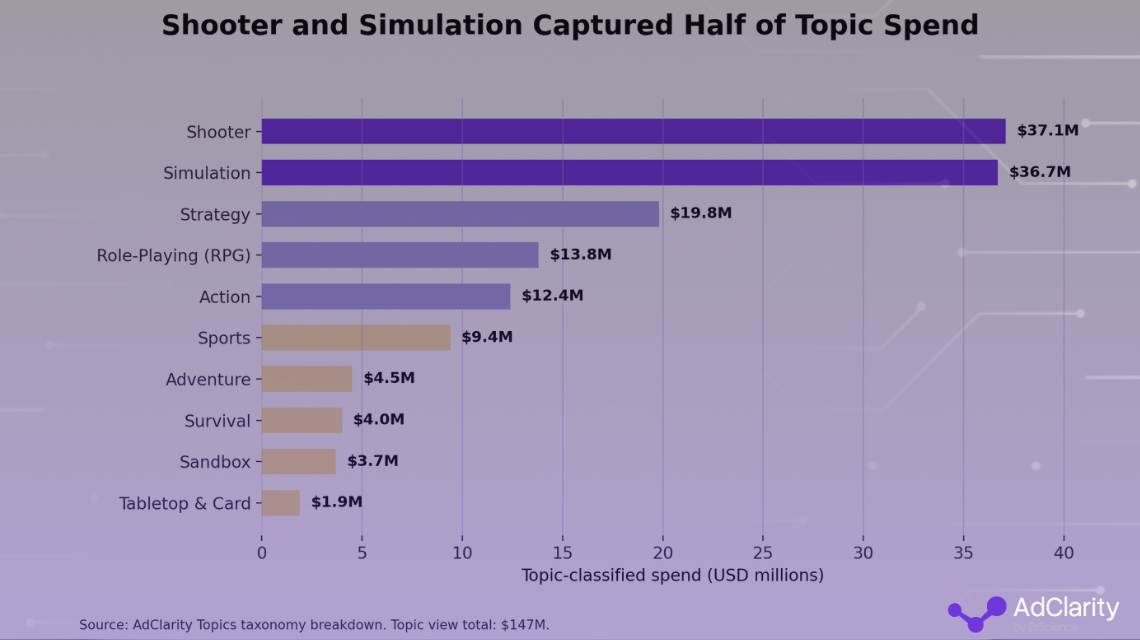
AdClarity’s Topics view classified $147M into game genres and subgenres. Shooter led with $37.1M, narrowly ahead of Simulation at $36.7M. Strategy followed at $19.8M, then Role-Playing at $13.8M and Action at $12.4M. Shooter and Simulation together represented 50.2% of topic-classified spend, while the top five Topics accounted for 81.5%.
Sub-Topics sharpen the picture further. Shooter activity included $7.2M for Vehicular Shooter and $6.5M for Tactical Shooter. Strategy included Build and Battle and 4X and Grand Strategy. Instead of comparing every game advertiser together, teams can build a benchmark around the genres and mechanics that define the real competitive market, as well as the specific products.

The Leaderboard Mixed Platforms, Publishers, and Titles
Steam led the broader market with $68.8M in spend, followed by Plarium at $26.3M. Doomsday: Last Survivors reached $22.6M, Mistplay $16.9M, and WORLD of EMERGENCY $15.8M.
The report also surfaced prominent titles including War Robots, War Thunder, Magic: The Gathering, Taonga: The Island Farm, Elvenar, Fortnite, World of Warships, and Total Battle. This mix illustrates why product taxonomy matters: a broad category leaderboard can combine storefronts, publishers, rewards platforms, and individual games that require very different competitive comparisons.

Publisher Spend Was Highly Concentrated
Facebook captured $142.6M, or 43.7% of publisher spend. TikTok followed with $46.8M. Combined YouTube web and app entries represented $36.7M, while Instagram contributed $33.5M. Together, those four platforms captured 79.5% of publisher spend.
The concentration reinforces the importance of connecting publisher activity to genre and title. The most important platform for the overall category may not be the most important one for a specific shooter, strategy title, or launch audience.

Tags Reveal an Even More Relevant Competitive Set
To demonstrate this capability, we applied the “Free-to-Play” tag. This narrowed the view to about $14M in spend, 1.9B impressions, 228 campaigns, 6.5K ads, and 1.9K publishers. Total Battle led the segment with $2.39M, followed by War Thunder at $1.59M, Valorant at $1.25M, Nexon at $1.17M, Steam at $1.07M, and Taonga at about $975K.

That is the purpose of the new AdClarity Topics module. Gaming teams can filter by Topic, Sub-Topic, and Tags to analyze the exact market they manage, reduce manual cleanup, compare closer competitors, and connect creative and media strategy to a more credible benchmark. As Topics expands into additional categories, the same product-level precision becomes available to more teams across the platform.